In intraday trading, where market movements happen rapidly, reading and interpreting candle patterns is essential for making well-timed and profitable decisions. Candle patterns offer visual representations of market sentiment, helping traders understand whether buyers or sellers are dominating the market. In this blog, we'll explore how to identify key candle patterns and use them to make accurate predictions during intraday trading.
What Are Candlestick Patterns?
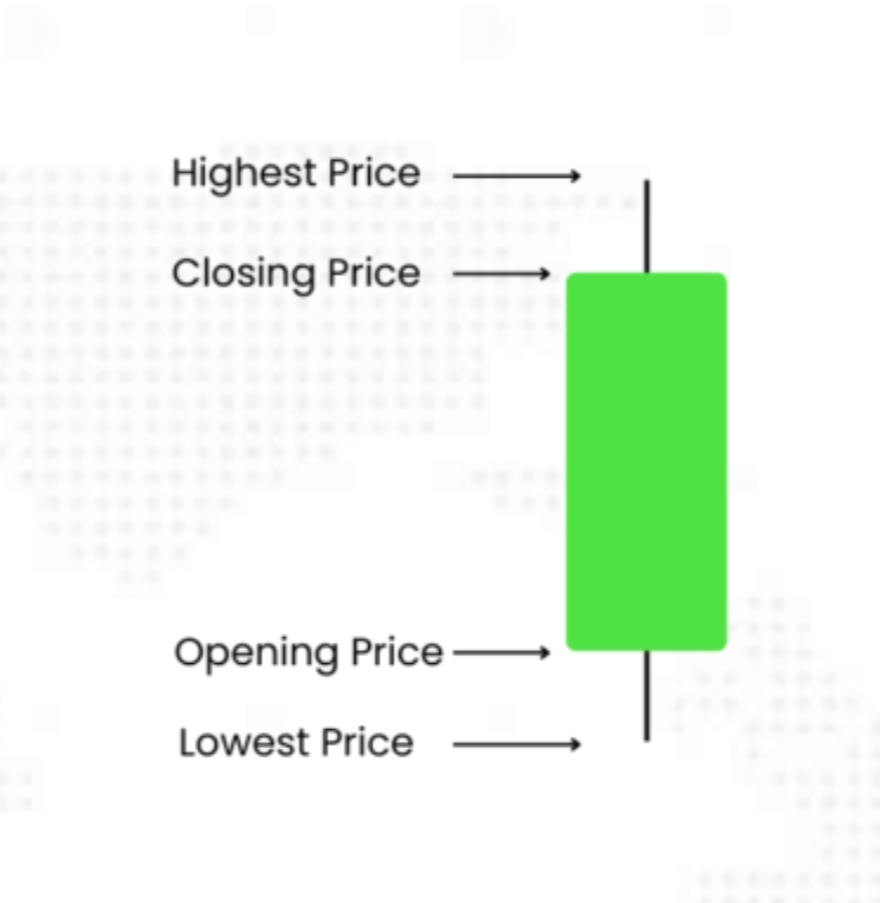
A candlestick represents price movement over a specific timeframe. Each candle has four key data points:
1. Open – The price when the timeframe started.
2. Close – The price when the timeframe ended.
3. High – The highest price during the period.
4. Low – The lowest price during the period.
Candles can be either bullish (price rises) or bearish (price falls), and the relationship between different candles forms patterns that indicate potential market direction.
Importance of Candlestick Patterns in Intraday Trading
In intraday trading, traders rely on short-term price action to make quick trades. Candle patterns help in:
- Identifying trend reversals or continuations.
- Determining market sentiment (bullish or bearish).
- Finding the best entry and exit points.
By mastering candlestick patterns, traders can make more informed and accurate trading decisions.
Key Candlestick Patterns for Intraday Traders
Here are some of the most reliable candlestick patterns that intraday traders should know:
1. Doji
- Description: The Doji candle has almost equal opening and closing prices, forming a small body with long shadows on both sides.
- What it signals: A Doji indicates market indecision, as neither buyers nor sellers have taken control. It often precedes a trend reversal, especially after a strong uptrend or downtrend.
- How to use it: If a Doji appears after a long bullish run, it could signal an upcoming bearish reversal, making it a good time to exit a long position.

2. Engulfing Pattern (Bullish and Bearish)
- Bullish Engulfing: A small bearish candle is followed by a larger bullish candle that completely engulfs the previous one.

- Bearish Engulfing: A small bullish candle is followed by a larger bearish candle that engulfs the previous one.
- What it signals: Engulfing patterns suggest a strong reversal of the previous trend.
- How to use it: A bullish engulfing pattern at the bottom of a downtrend indicates that buyers are gaining control, making it a signal to enter a long trade. Conversely, a bearish engulfing pattern at the top of an uptrend suggests sellers are taking over.
3. Hammer and Hanging Man

- Hammer: A small body with a long lower shadow. Appears at the bottom of a downtrend.
- Hanging Man: Similar to the hammer but appears at the top of an uptrend.
- What it signals: Both patterns indicate a potential reversal.
- How to use it: A hammer indicates that buyers have rejected lower prices, and a reversal to the upside may be imminent. A hanging man suggests that sellers are testing the market and a bearish reversal could occur.
4. Shooting Star

- Description: A bearish reversal pattern with a small body and a long upper shadow, usually appearing at the top of an uptrend.
- What it signals: The long upper shadow suggests that the bulls have lost momentum, and sellers are stepping in.
- How to use it: If a shooting star appears in an uptrend, it could be a signal to exit long positions and consider shorting, as the market may soon reverse downward.
5. Morning Star and Evening Star
- Morning Star: A three-candle pattern that signals a bullish reversal. It begins with a bearish candle, followed by a small indecisive candle (usually a Doji), and ends with a bullish candle.

- Evening Star: A bearish reversal pattern that starts with a bullish candle, followed by a small indecisive candle, and ends with a bearish candle.

- What it signals: The Morning Star indicates the end of a downtrend and the beginning of an uptrend, while the Evening Star signals the end of an uptrend.
- How to use it: These patterns work best in combination with other technical indicators like moving averages or support/resistance levels. A Morning Star at support or an Evening Star at resistance adds further confirmation of the reversal.
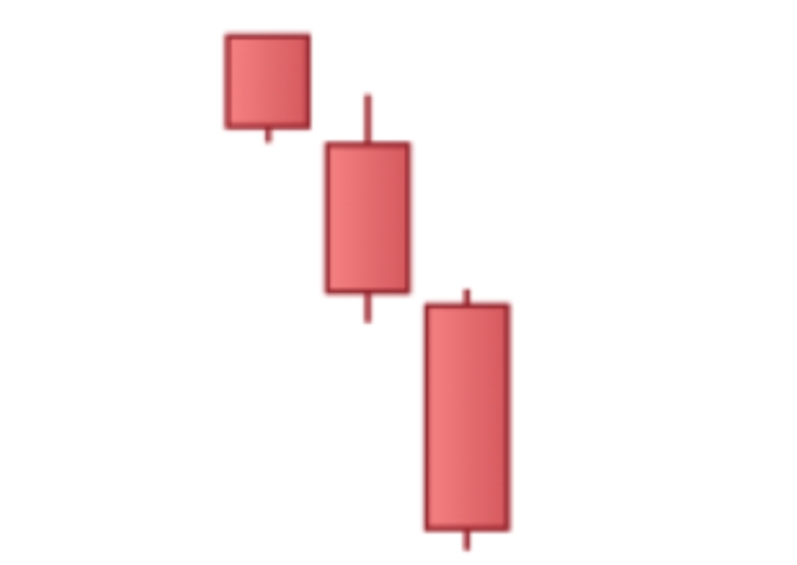
6. Three Black Crows and Three White Soldiers
- Three Black Crows: Three consecutive bearish candles, each closing lower than the previous one.
- Three White Soldiers: Three consecutive bullish candles, each closing higher than the previous one.

- What it signals: These patterns indicate a strong trend reversal. Three Black Crows signal a reversal from a bullish to a bearish trend, while Three White Soldiers suggest a reversal from bearish to bullish.
- How to use it: These patterns are reliable in identifying a strong change in market sentiment, making them ideal for initiating trades in the direction of the new trend.
7. Harami (Bullish and Bearish)
- Bullish Harami: A small bullish candle within the range of a larger bearish candle.

- Bearish Harami: A small bearish candle within the range of a larger bullish candle.

- What it signals: The Harami pattern suggests a weakening of the current trend and a possible reversal.
- How to use it: Look for a bullish Harami in a downtrend to signal an upcoming reversal and a bearish Harami in an uptrend as a potential warning to exit long trades.
How to Effectively Use Candle Patterns in Intraday Trading
While candlestick patterns are powerful tools, they should be used in combination with other technical analysis techniques for greater accuracy.
1. Combine with Technical Indicators
Using technical indicators like Relative Strength Index (RSI), Moving Averages, or Bollinger Bands can confirm candlestick signals. For example, if a bullish candlestick pattern appears when RSI shows oversold conditions, it strengthens the signal to buy.
2. Look for Patterns at Key Levels
Candlestick patterns are more reliable when they form at significant support or resistance levels. A bullish engulfing pattern at a strong support zone is more likely to lead to a trend reversal.
3. Use Volume to Confirm
Higher trading volume during the formation of a candlestick pattern increases its reliability. A bullish reversal pattern with high volume suggests stronger buyer commitment and a higher chance of trend reversal.
4. Watch for Fakeouts
In volatile markets, false signals can occur. Always wait for confirmation—a follow-up candle that aligns with the direction of the pattern—before entering a trade.
5. Practice Patience
Intraday trading can be fast-paced, but it’s important not to rush into trades. Wait for confirmation and combine multiple technical tools to increase the probability of successful trades.
Conclusion
Candlestick patterns offer valuable insights into market behavior, making them essential tools for intraday traders. By learning to recognize and interpret key patterns such as Doji, Engulfing, Hammer, and Shooting Star, traders can make more accurate predictions about price movements and improve their entry and exit points. However, always combine candlestick patterns with other technical analysis tools and risk management strategies to increase your chances of success.
Mastering candlestick patterns takes time and practice, but once understood, they can become a powerful part of your intraday trading arsenal.
This guide should help your readers grasp the basics of candlestick patterns and how to apply them effectively in intraday trading. Let me know if you need further adjustments!

